Data visualisation and infographics
Various clients
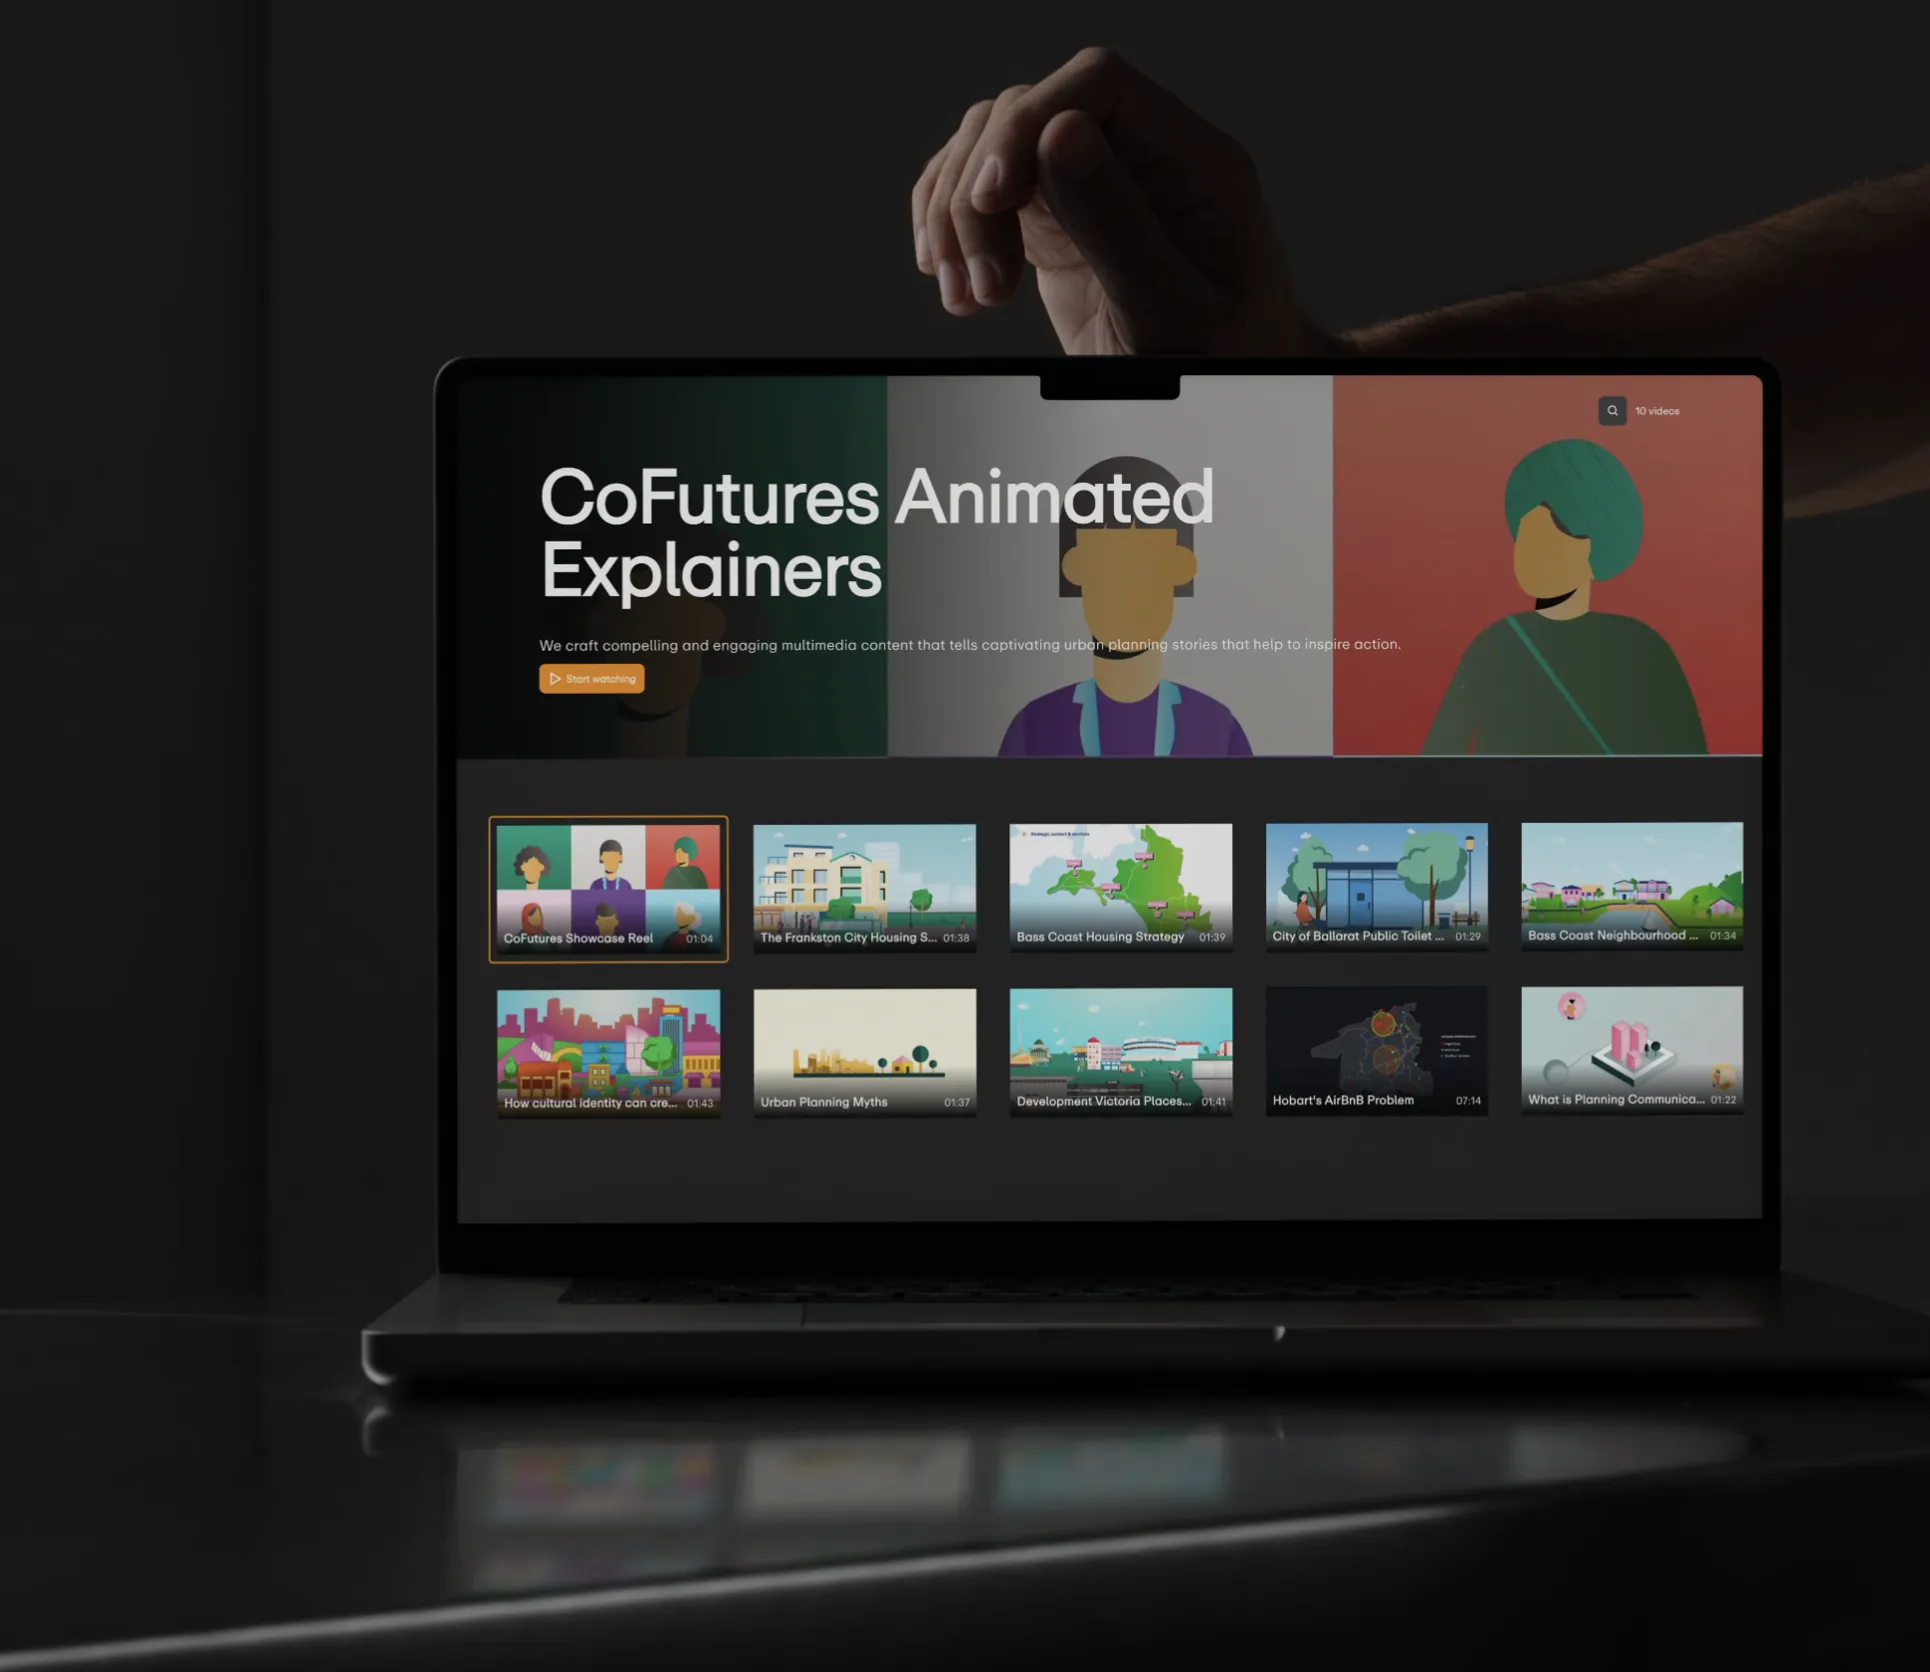
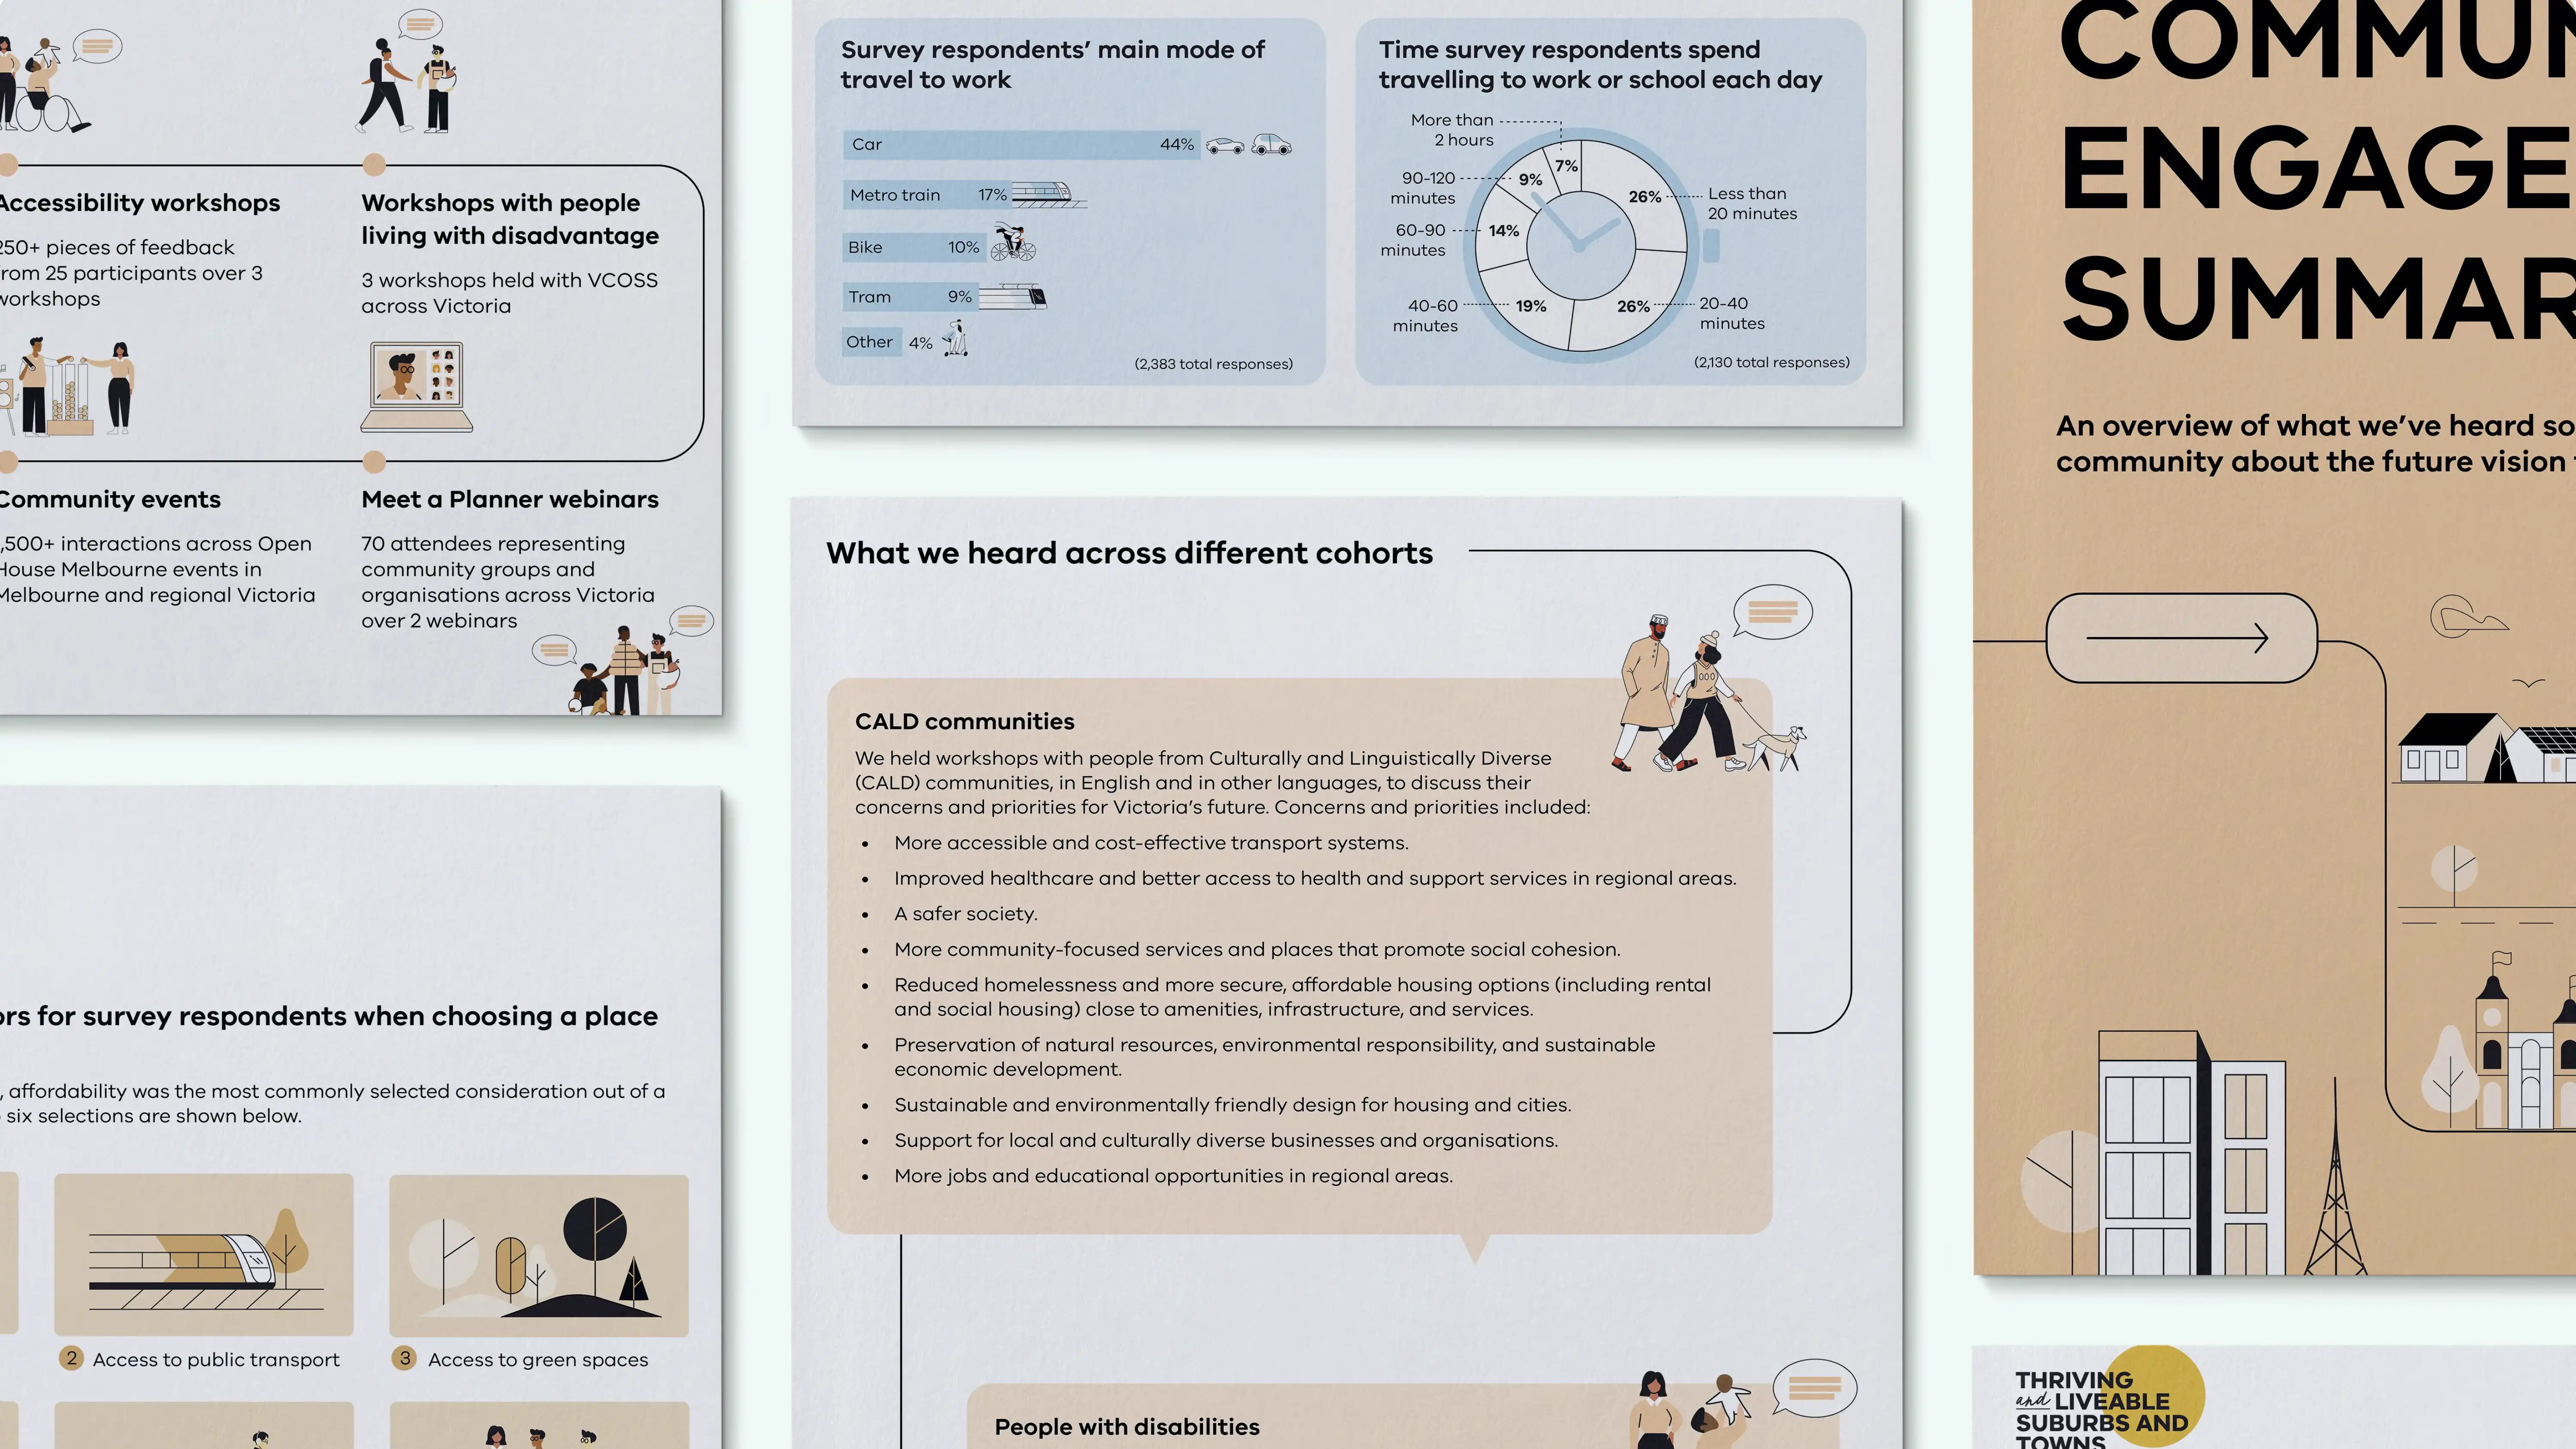
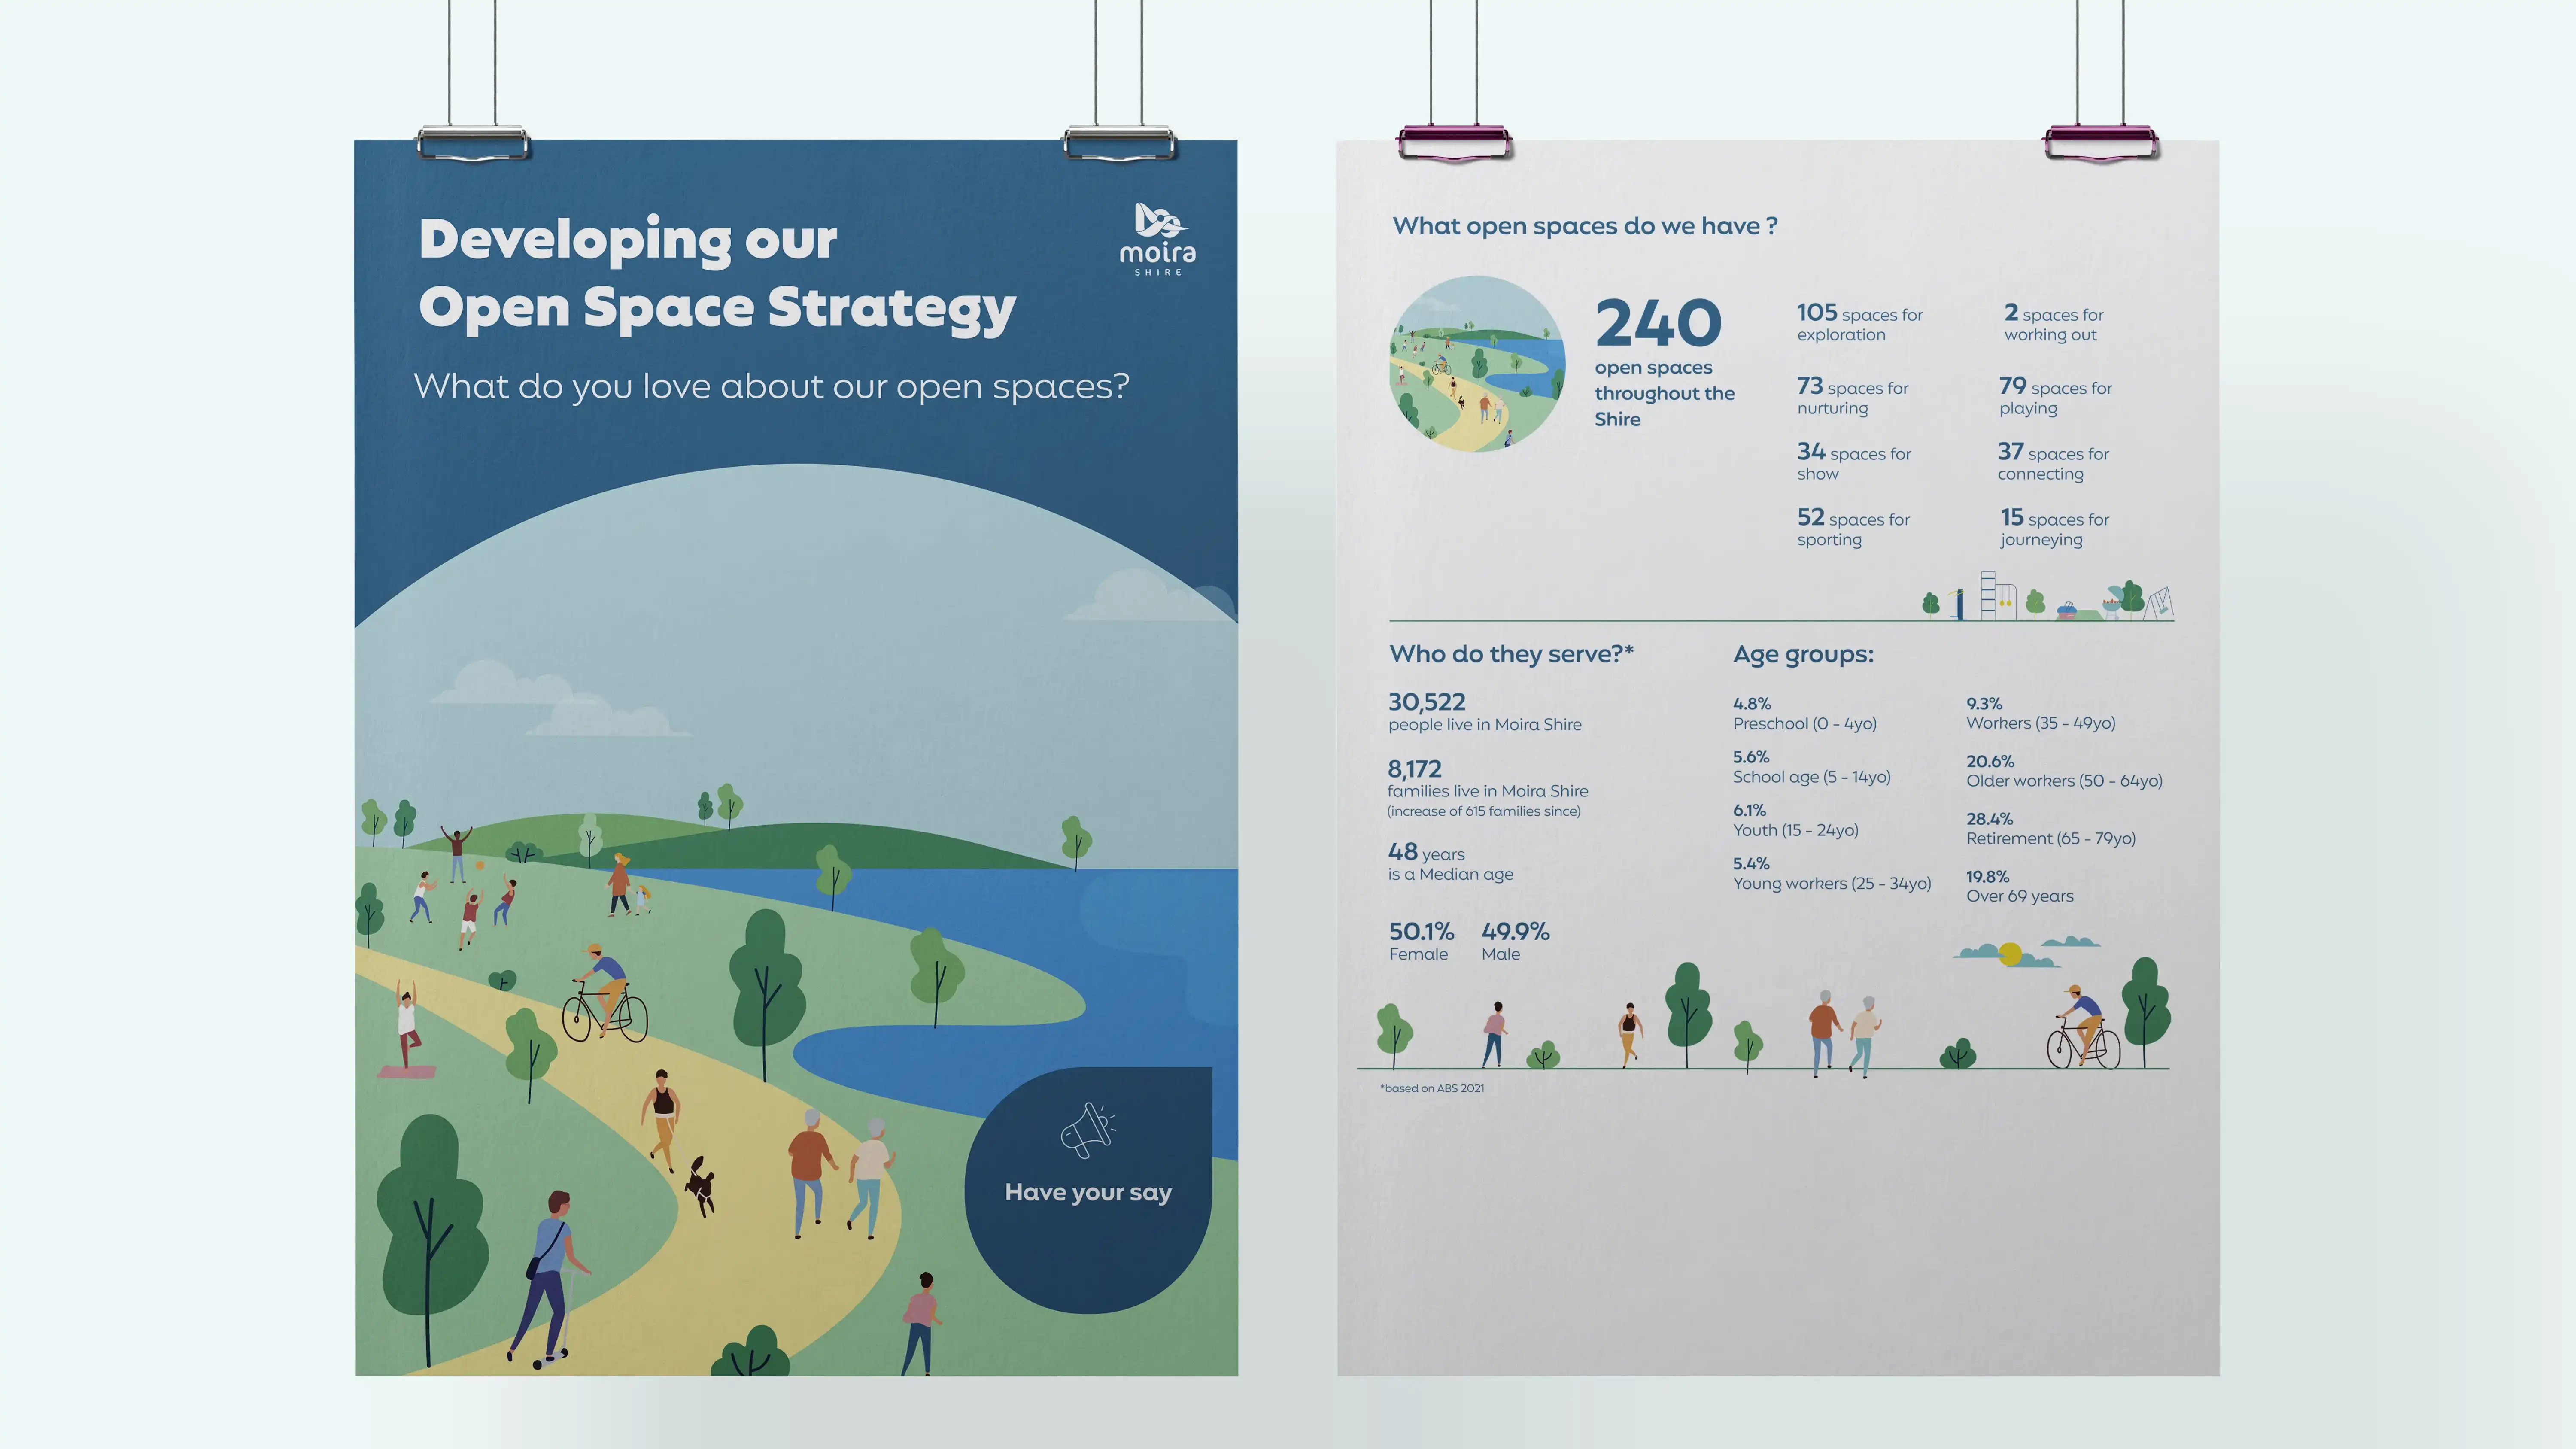
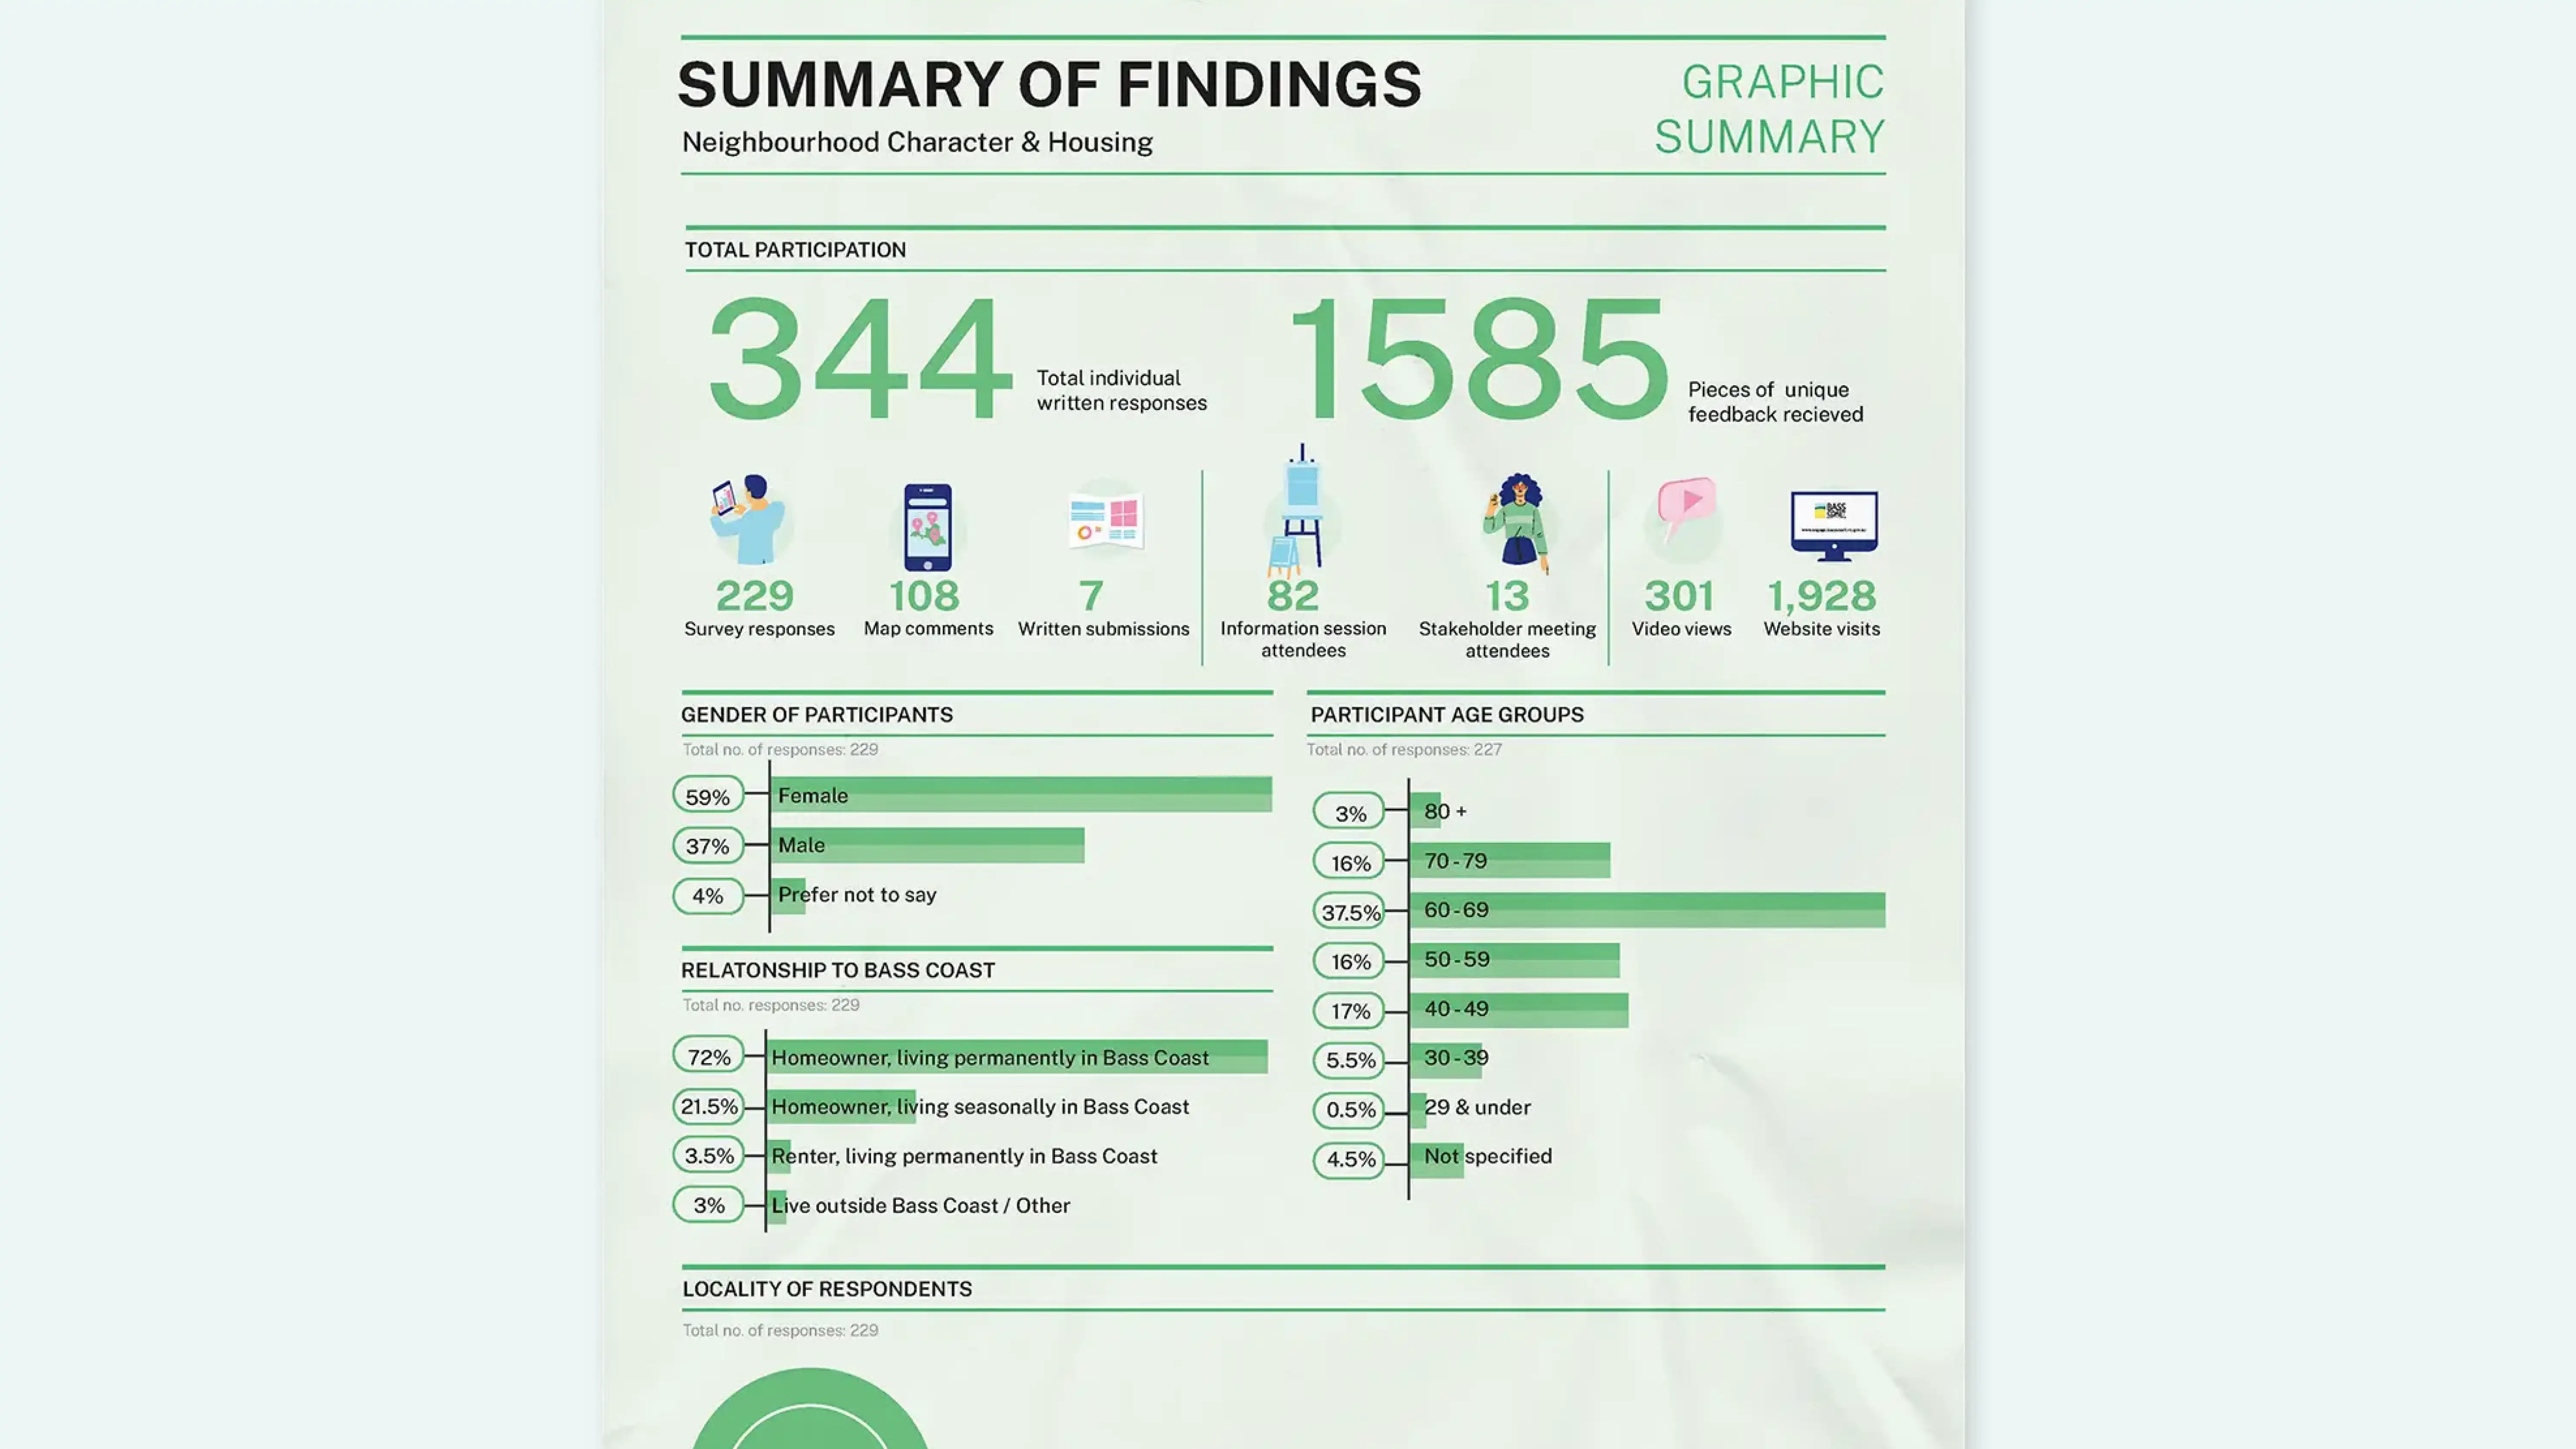
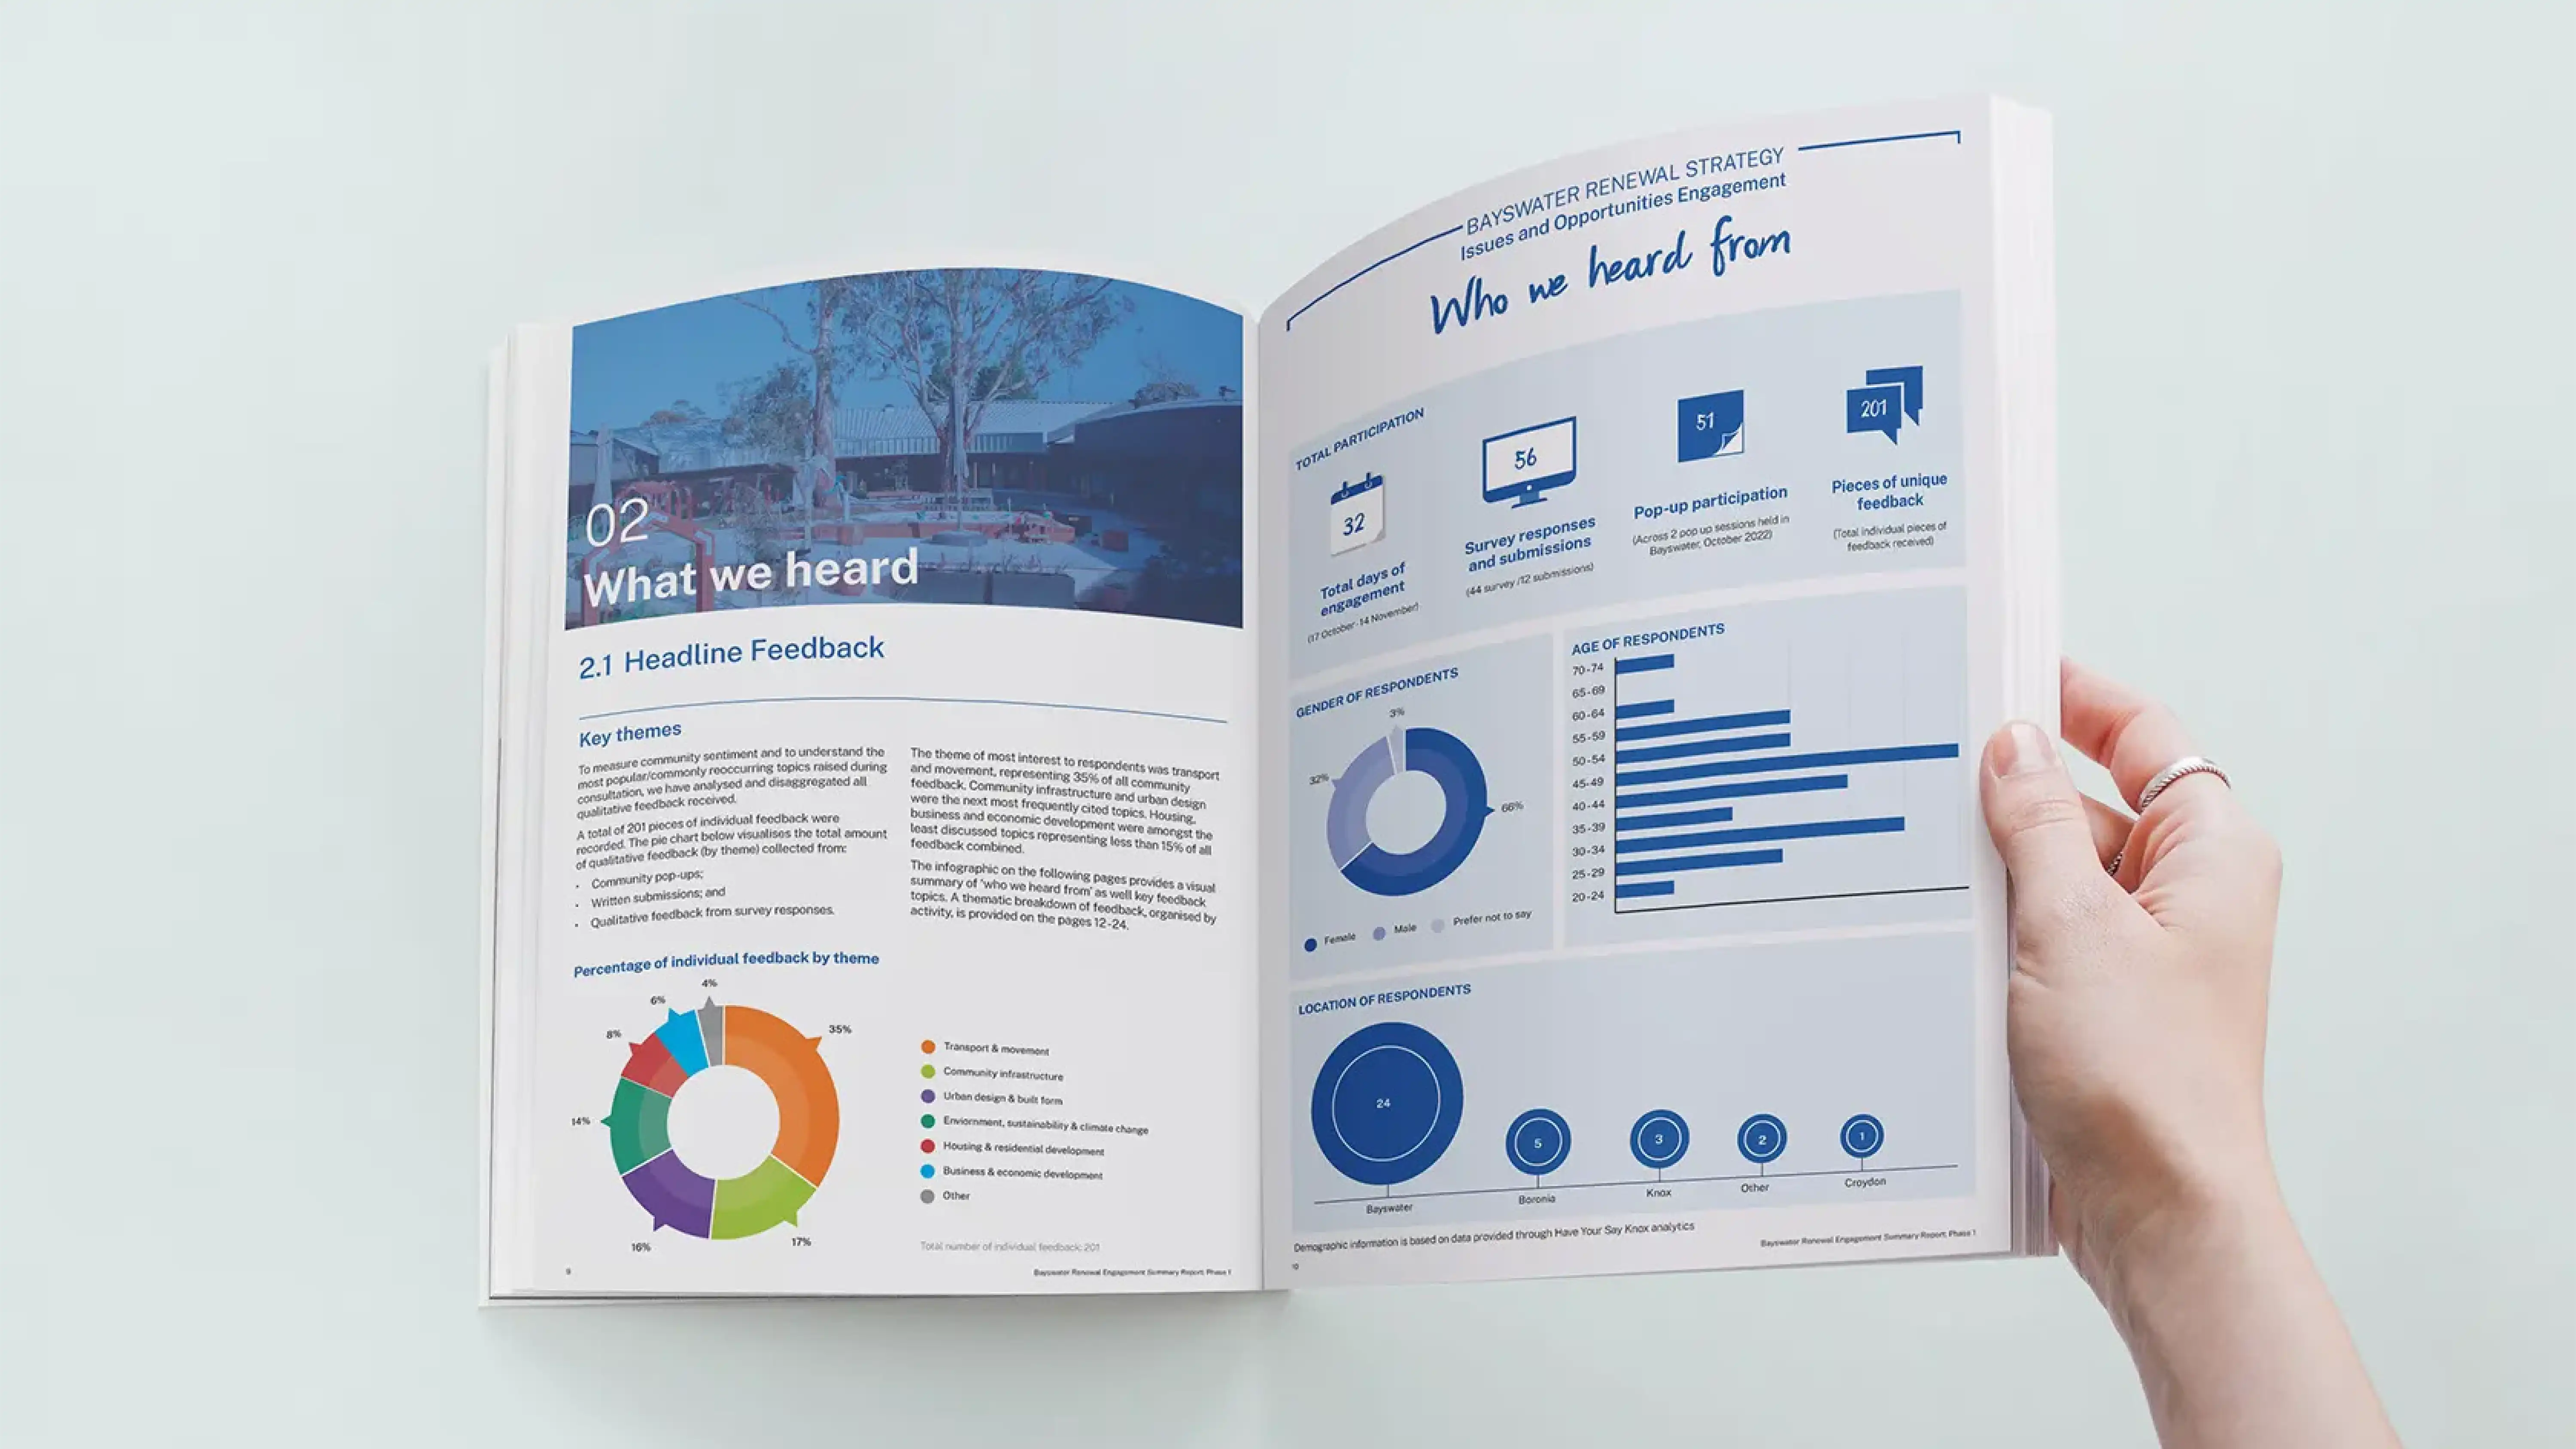
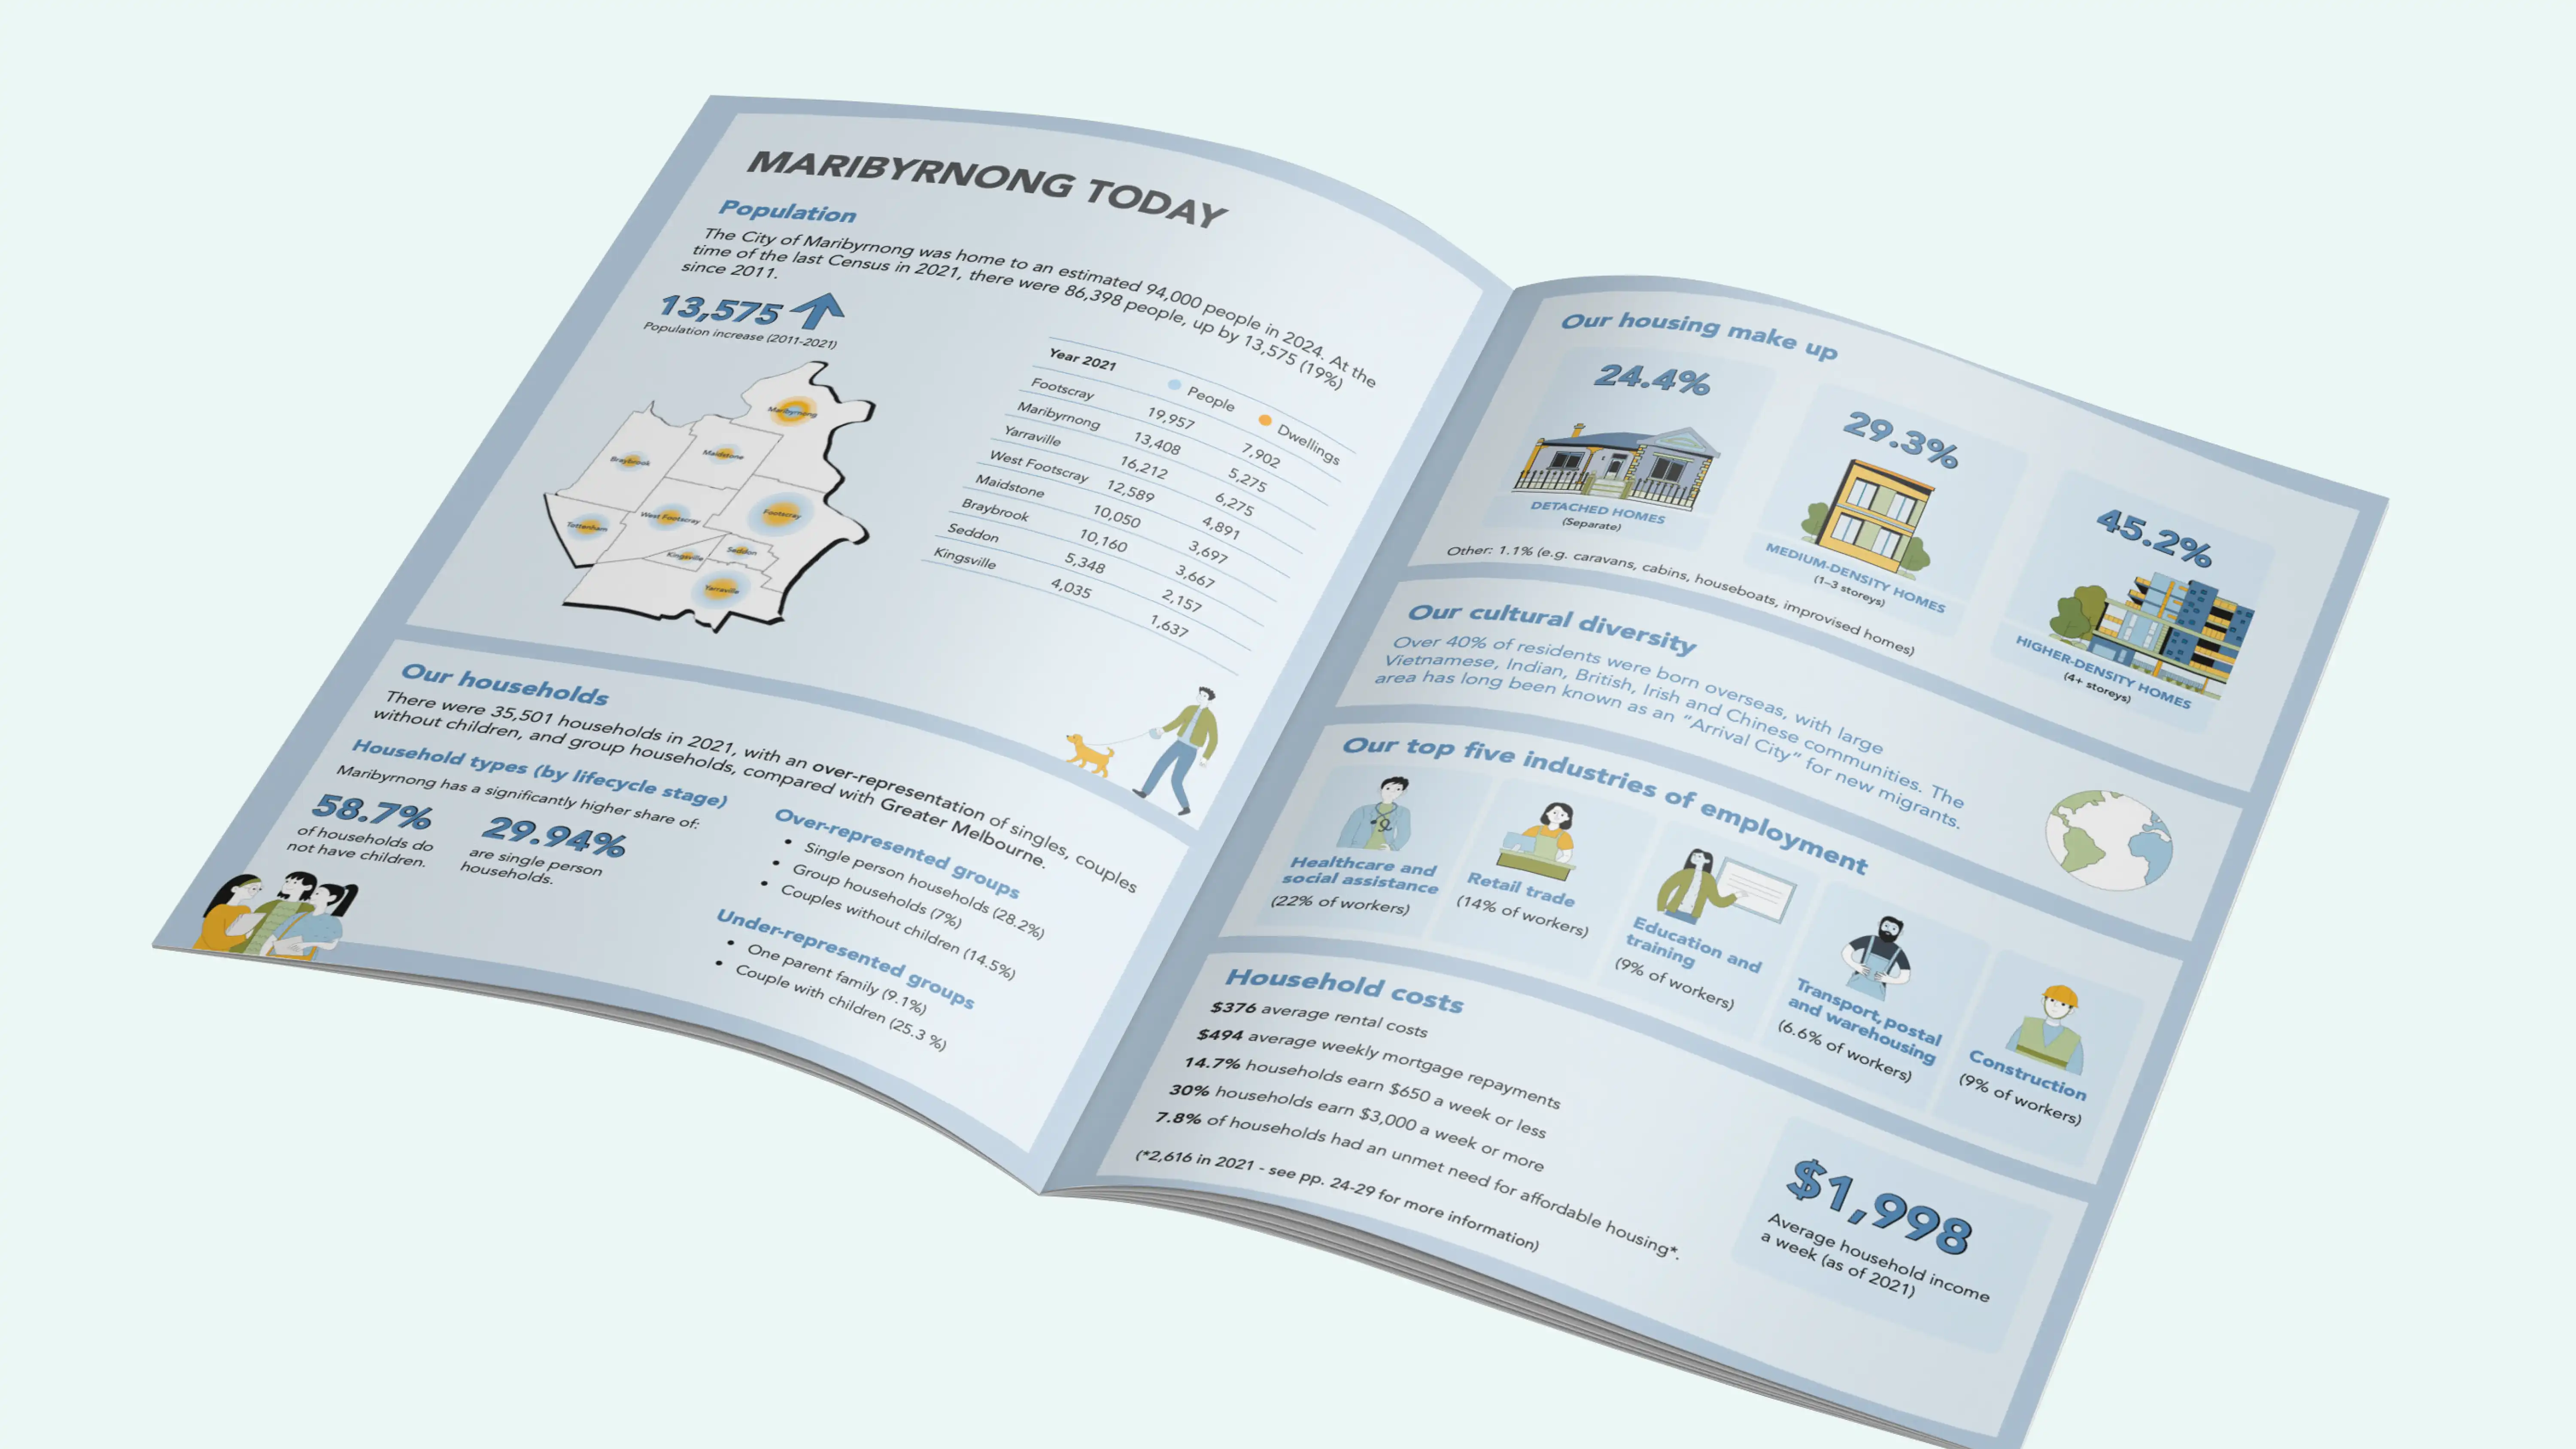
We turn data, research and evidence into clear, easy-to-understand visuals. We help our clients present information in a way that is simple, engaging and focused on what matters most.
Speak to one of our creatives
Do you have a creative project in mind? Let's chat!
Fill out the form or get in touch with us admin@cofutures.com.au
Oops! Something went wrong while submitting the form.